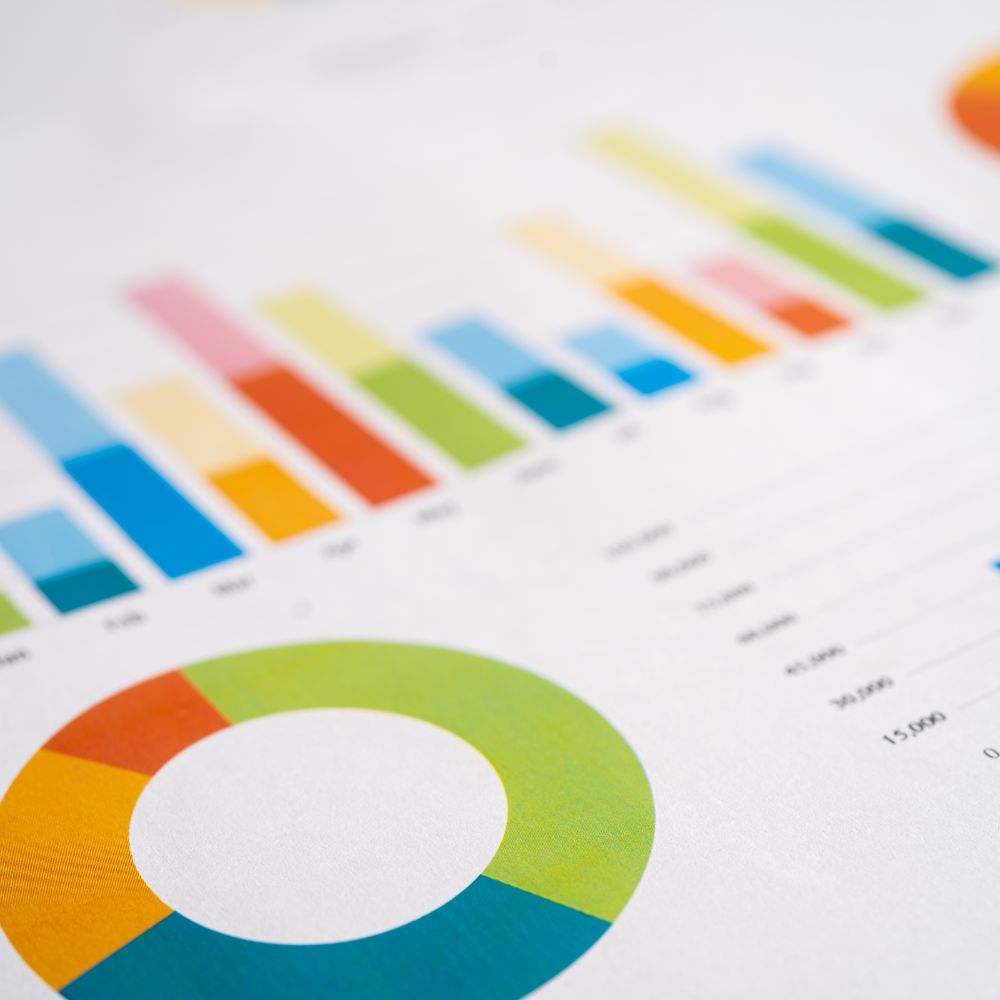
Develop Visualization Techniques for Financial Data (e.g., Charts, Graphs)
Service Overview:
TEMS Tech Solutions specializes in creating advanced data visualization techniques that transform complex financial data into easily interpretable charts, graphs, and dashboards. These visualizations enable quick analysis and actionable insights.
Service Components:
-
Custom Dashboards
Design and develop intuitive dashboards that display key financial metrics and data trends in an easy-to-understand format. -
Interactive Graphs
Create interactive graphs and charts that allow users to drill down into specific data points and analyze detailed financial information. -
Real-Time Data Visualization
Implement real-time data visualizations to provide up-to-date insights into financial performance, enabling quick decision-making. -
Trend Analysis
Design visual tools to highlight trends in financial data over time, such as revenue growth, expense patterns, and profitability shifts. -
Data Exporting and Sharing
Provide options to export visualizations into formats suitable for reports, presentations, or sharing with stakeholders.
Why Choose TEMS Tech Solutions [TTS]?
TTS creates dynamic, visually appealing financial dashboards and graphs that make it easy for businesses to understand their data, identify trends, and make informed decisions.


Reviews
There are no reviews yet.