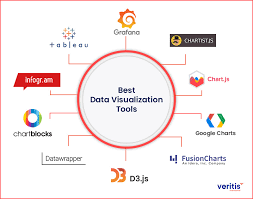
At Tems Tech Solutions (TTS), we provide expert services to Implement Data Visualization Tools and Charts that transform raw data into actionable insights. Our team creates interactive, dynamic, and visually appealing charts, graphs, and dashboards that allow businesses to better understand and analyze their data. We work with a variety of data visualization libraries and tools, such as D3.js, Chart.js, Power BI, and Tableau, to deliver customized solutions that fit your specific needs.
From financial trends and operational performance to customer behavior, our visualizations simplify complex data, enabling your team to make faster, data-driven decisions.
Key Features:
- Interactive charts and graphs (bar, line, pie, scatter, etc.)
- Real-time data visualization with dynamic updates
- Custom dashboards tailored to your business needs
- Integration with external data sources and APIs
- User-friendly interface for filtering and exploring data
- Support for both web and mobile platforms
With Tems Tech Solutions, you can transform how you view and use your data, providing your business with a clear, visual representation of key metrics and performance indicators.


Reviews
There are no reviews yet.